
The result before the explanation
On a frozen run dated 18 August 2026, KolliPack evaluated 700 public Bischoff–Ratcliff benchmark cases in four modes: 2,800 complete solves. Its strongest standalone mode for the benchmark's pure utilization objective—Space Evenly with Mixed Cargo Infill—averaged 83.666% of container volume. The full-support CLTRS reference reported by Fanslau and Bortfeldt averaged 94.2% on BR1–BR7: a gap of 10.534 percentage points.
The gap is real. This article does not turn it into a claim that KolliPack beats academic optimization. It asks a more useful engineering question: what does the gap mean, what did the benchmark teach us about KolliPack, and how should a container-loading engine be compared fairly?
This article presents a focused comparison using KolliPack's dated BR1–BR7 benchmark results and public source material available on 20 August 2026. It is not a complete product evaluation, and the result should not be generalized beyond the stated benchmark, settings, and sources. KolliLabs/KolliPack is independent of and not affiliated with LoadingMCP.
Why 700 cases are more useful than a good screenshot
A loading result can look convincing in a single image. One shipment can also be unusually friendly to a particular orientation, product order, or block shape. Neither is enough to establish optimizer quality.
A benchmark is useful because it holds the question still. The same cargo dimensions, quantities, orientation permissions, container, objective, and scoring convention are presented to every method. A large set then exposes both easy cases and awkward combinations that a demonstration would naturally leave out.
For this article, utilization means the volume of boxes actually placed divided by the internal container volume. It is an important geometric measure, but it is not a complete description of a released load. The score does not tell us whether a load is easy to unload, balanced over axles, secure under a particular transport profile, kind to fragile products, or practical for a warehouse team.
In a real shipment, higher utilization can mean more cargo per container or fewer containers for the same cargo. That consequence only follows when the cargo, operational rules, and physical validation remain acceptable.
What the Bischoff–Ratcliff BR1–BR7 suite is
The OR-Library container-loading page identifies thpack1 through thpack7 as data files generated and used in E. E. Bischoff and M. S. W. Ratcliff's 1995 paper, “Issues in the Development of Approaches to Container Loading”. The OR-Library describes them as single-container loading problems whose objective is to maximize container volume utilization. Each box dimension carries a 0/1 flag indicating whether that dimension may be used vertically.
The seven classes contain 100 cases each. Their box-type counts increase as follows:
| Class | Cases | Box types | What changes |
|---|---|---|---|
| BR1 | 100 | 3 | Lower heterogeneity |
| BR2 | 100 | 5 | More competing dimensions |
| BR3 | 100 | 8 | More mixed cargo choices |
| BR4 | 100 | 10 | Higher heterogeneity |
| BR5 | 100 | 12 | Higher heterogeneity |
| BR6 | 100 | 15 | Strongly mixed cargo |
| BR7 | 100 | 20 | Most mixed cargo in this suite |
That structure is why BR1–BR7 is a useful research fixture. Everyone can run the same public inputs, and the later classes ask whether an algorithm can keep finding compatible arrangements as the number of box types grows. The benchmark values are comparison results—not proof that any reported method has found the mathematical optimum for every case.
How KolliPack was tested
The article documents the 2026-08-18 benchmark snapshot, not a rerun of whatever code happens to be checked out today. The frozen run used the approved deterministic Transport Container engine snapshot recorded in the benchmark handover.
The test matrix was deliberately narrow:
| Input or rule | Frozen benchmark setting |
|---|---|
| Dataset | BR1–BR7, 100 cases per class |
| Container | 587 × 233 × 220 dataset units, represented locally as 5,870 × 2,330 × 2,200 mm |
| Orientation permissions | Source vertical flags mapped to KolliPack R1/R2/R3 without adding orientations |
| Product state | Stackable = true; weight = 0; sequence = 1 |
| Objective | Pure container-volume utilization |
| Modes | Space Evenly; Space Evenly – Mixed Cargo Infill; Front-to-Back; Front-to-Back – Mixed Cargo Infill |
| Validation | Bounds, positive-volume overlap, and support of elevated placements |
The source flags were mapped as recorded in the handover: source height permitted vertically → KolliPack R1; source width permitted vertically → R2; source length permitted vertically → R3. No weight restriction or sequence constraint was added to a volume-only fixture.
Utilization was calculated from the actual placements returned by each mode. Every one of the 2,800 outputs passed KolliPack's internal geometry validation for container bounds, positive-volume overlap, and support of elevated placements. That is a narrow geometry statement—not physical certification, transport approval, compression validation, or load-securing compliance.
The four-mode result
The complete suite produces a useful separation between a fast baseline, a more capable infill mode, and a longitudinal loading philosophy.
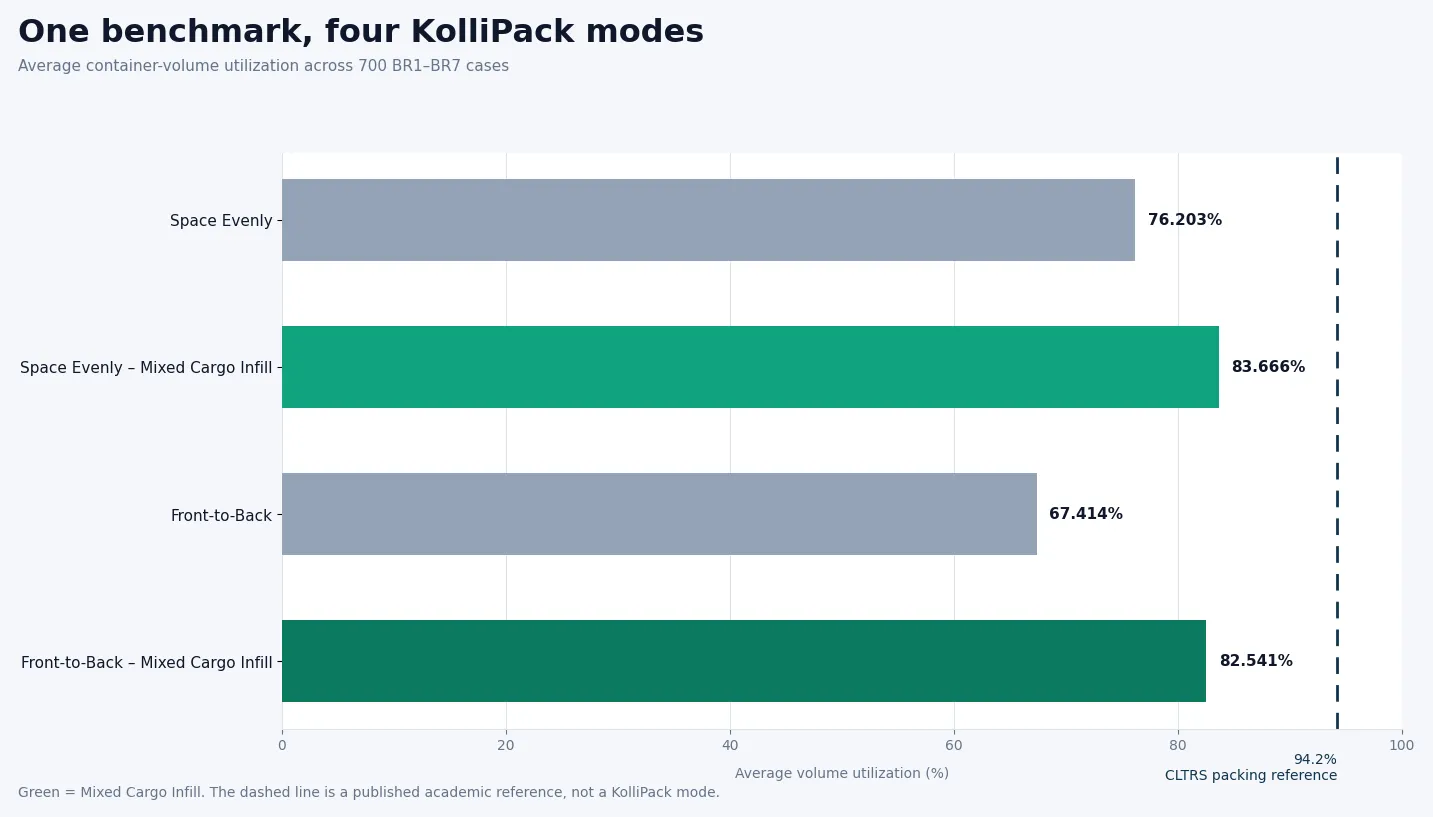
| Mode | Average | Median | Minimum | Maximum |
|---|---|---|---|---|
| Space Evenly | 76.203% | 76.146% | 53.409% | 93.052% |
| Space Evenly – Mixed Cargo Infill | 83.666% | 83.687% | 68.341% | 93.052% |
| Front-to-Back | 67.414% | 67.522% | 41.782% | 91.918% |
| Front-to-Back – Mixed Cargo Infill | 82.541% | 82.766% | 67.009% | 92.660% |
There is also a retrospective best-per-case envelope of 84.453%. That number selects whichever of the four modes happened to score higher for each case; it is not a fifth standalone algorithm configuration and should not be presented as one.
What Mixed Cargo Infill changed
Mixed Cargo Infill is the clearest internal result in the benchmark. In plain terms, it lets the engine use structured leftover regions at the side or on a supported top surface with other permitted cargo instead of stopping after the first block arrangement. The side-residual and supported-top residual closures did more than produce a better-looking render:
| Mode family | Without infill | With infill | Change |
|---|---|---|---|
| Space Evenly | 76.203% | 83.666% | +7.463 percentage points |
| Front-to-Back | 67.414% | 82.541% | +15.127 percentage points |
Across 700 independent cases, residual-space closure recovered a substantial amount of usable volume. That is an engineering result worth keeping separate from the broader question of whether the engine has enough global foresight.
The two infill modes also show why a benchmark objective cannot be interpreted without a mode definition. Space Evenly Infill won 433 cases; Front-to-Back Infill won 257; 10 were ties. Space Evenly has more geometric freedom. Front-to-Back deliberately loads longitudinally, from the back toward the doors, because an operationally understandable loading progression can matter even when the benchmark score does not measure it. It would be surprising if that additional operational structure automatically won a pure cube-utilization contest.
The academic gap is real
Fanslau and Bortfeldt's CLTRS paper describes two variants. Full support from below means that an elevated box must rest on supporting geometry below it rather than being left suspended over a gap. The packing variant requires that support; the cutting variant does not enforce it. For this comparison, the packing variant is the relevant reference because it is closer to a physically supported load.
CLTRS combines generalized block building with partition-controlled tree search. Its generalized blocks can combine different box types with small internal gaps, while the search keeps multiple alternatives alive long enough to provide more width and foresight than a bounded constructive decision.
The paper reports these BR1–BR7 packing-variant averages for 100 cases per class:
| Class | Box types | KolliPack Space Evenly Infill | CLTRS packing variant | Gap |
|---|---|---|---|---|
| BR1 | 3 | 84.952% | 94.51% | 9.558 pp |
| BR2 | 5 | 85.096% | 94.73% | 9.634 pp |
| BR3 | 8 | 84.711% | 94.74% | 10.029 pp |
| BR4 | 10 | 83.754% | 94.41% | 10.656 pp |
| BR5 | 12 | 83.192% | 94.13% | 10.938 pp |
| BR6 | 15 | 82.556% | 93.85% | 11.294 pp |
| BR7 | 20 | 81.403% | 93.20% | 11.797 pp |
| BR1–BR7 | — | 83.666% | 94.2% | 10.534 pp |
That is not a rounding issue or a flattering choice of one case. Under the stated pure-volume comparison, the published academic reference is materially higher. The honest conclusion is that a sophisticated search method extracts more cube utilization from this fixture than KolliPack's bounded constructive method currently does.
The result also sits within a published spectrum rather than outside history. In Table 4, Fanslau and Bortfeldt report full-support BR1–BR7 averages of approximately 88.5% for Terno et al.'s B&B, 90.1% for Bortfeldt/Gehring's GA, 90.4% for the parallel GA, 88.8% for Eley's TRS, 90.5% for Bischoff's method, 89.7% for Moura/Oliveira's GRASP, and 94.2% for CLTRS. Support-free results are not mixed into that comparison here.
The paper reports historical CPU times alongside those results, but comparing those raw seconds with a modern run would be misleading: processors, implementations, stopping rules, and environments differ. This article therefore compares the utilization metric and keeps runtime as a separate engineering concern.
Why the gap exists
KolliPack and CLTRS are not the same kind of decision system. Here, a Product Block means a structured rectangular group of one or more cargo boxes that the constructive engine can place as a unit.
| KolliPack's deliberate priorities | CLTRS's deliberate priorities |
|---|---|
| Deterministic constructive results | Partition-controlled tree search |
| Structured Product Blocks | Generalized blocks mixing box types |
| Bounded local frontiers and residual closure | Multiple alternatives and broader foresight |
| Explainable, reproducible geometry | More global combinatorial exploration |
More global search can recover arrangements that a local constructive method closes off too early. A bounded engine gives up some of that search power in exchange for repeatability, predictable structure, and a result that can be explained and reused in an operational workflow. That trade-off is deliberate, but it still has a measurable cost in pure cube utilization. The benchmark makes that cost visible instead of hiding it.
The point is not that one philosophy is universally superior. A shipping team may value a different load sequence, access pattern, or review process than a benchmark that only asks for the fullest rectangular volume.
More product types expose more internal loss
The heterogeneity curve is one of the most useful diagnostic signals in the data. Space Evenly Infill rises slightly from BR1 to BR2, then declines from 84.952% in BR1 to 81.403% in BR7. Front-to-Back Infill follows the same broad direction, ending at 80.394% in BR7.
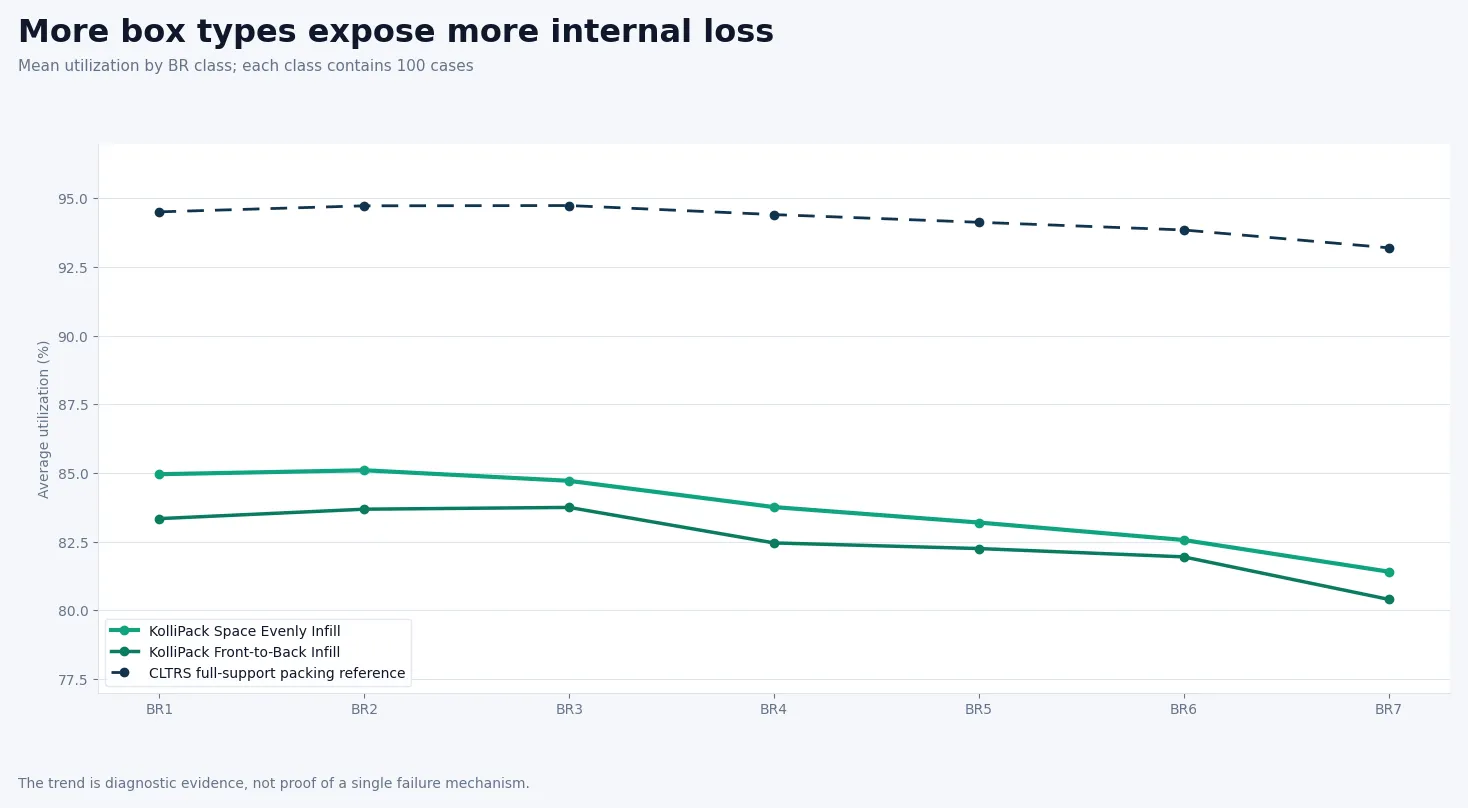
This does not prove that Product Blocks are wrong. It says that increasing heterogeneity is an area for diagnosis. The Fanslau–Bortfeldt paper describes a related pattern: as box sets become strongly heterogeneous, internal losses inside larger arrangements become more important, and generalized blocks become more valuable. A local residual patch may not be enough if the deeper issue is how several product types are composed before the residual spaces exist.
That is a research hypothesis, not a code-change instruction. The benchmark tells us where to look; geometry and diagnostics still have to tell us what happened.
A commercial reference, with a narrow scope
LoadingMCP's public research and benchmarks page says that its optimizer is built on PackingSolver and reports, for a July 2026 benchmark, 86.4% on BR1, 85.3% on BR5, 82.6% on BR7, and about 85% overall. These are vendor-published figures. KolliLabs did not independently reproduce LoadingMCP under the frozen KolliPack harness.
For the three classes LoadingMCP publishes explicitly, the numerical neighborhood looks like this:
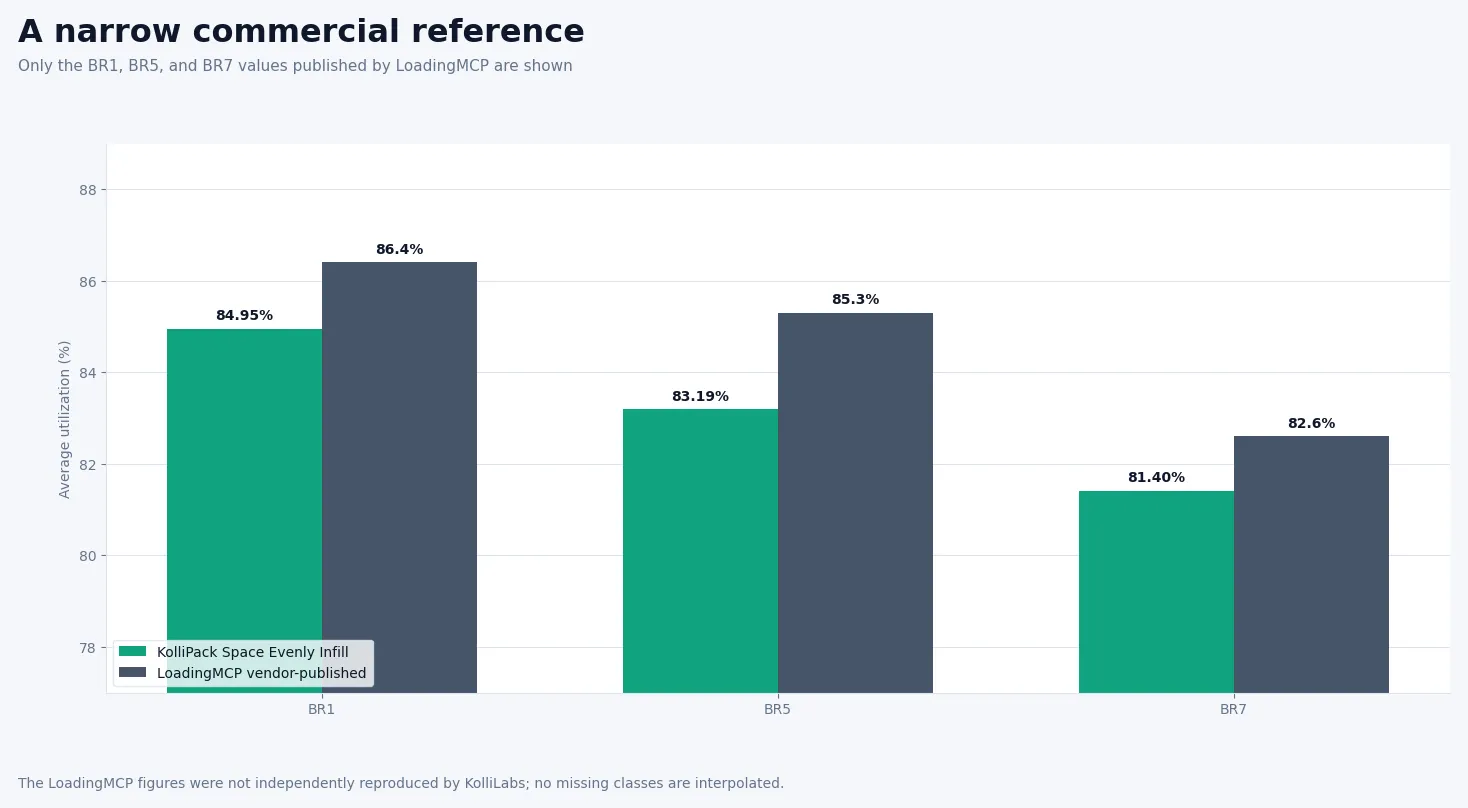
KolliPack's Space Evenly Infill values are approximately 1.45 points below LoadingMCP on BR1, 2.11 points below on BR5, and 1.20 points below on BR7. That places the two results in a similar numerical range on the published benchmark family, but it does not establish commercial parity, equal optimizer quality, equal constraints, equal runtime, or equal product capability.
LoadingMCP also associates its PackingSolver foundation with Florian Fontan and Luc Libralesso. The official ROADEF/EURO 2022 final results identify Fontan and Libralesso as the winning team in the final Renault truck-loading challenge. That confirms the competition result; it does not establish that LoadingMCP's production implementation is identical to that competition submission.
This comparison uses KolliPack's dated BR1–BR7 benchmark results and LoadingMCP's publicly reported figures available at the stated research date. The LoadingMCP results were not independently reproduced by KolliLabs. This is a benchmark comparison, not a complete product evaluation. KolliLabs/KolliPack is independent of and not affiliated with LoadingMCP.
What BR1–BR7 does—and does not—measure
The suite measures a narrow but valuable question: how much rectangular cargo volume can a method place inside one rectangular container under the stated dimensions, quantities, orientation permissions, and support assumptions.
It does not, by itself, measure:
- Loading-sequence quality or door access.
- Axle balancing or real load securing.
- Compression strength, fragility, or product damage risk.
- Forklift access, unloading ergonomics, or warehouse execution.
- Driver practicality, route rules, or carrier requirements.
- Visualization quality, explainability, UI workflow, reporting, or commercial maturity.
That list is not an excuse for the utilization gap. It is the boundary of what the score can honestly support. A high benchmark score still needs operational and physical validation; a lower score still identifies geometric opportunity.
Benchmarking as an engineering development loop
The benchmark is now part of KolliPack's engineering process, not only a marketing number. The intended loop is:
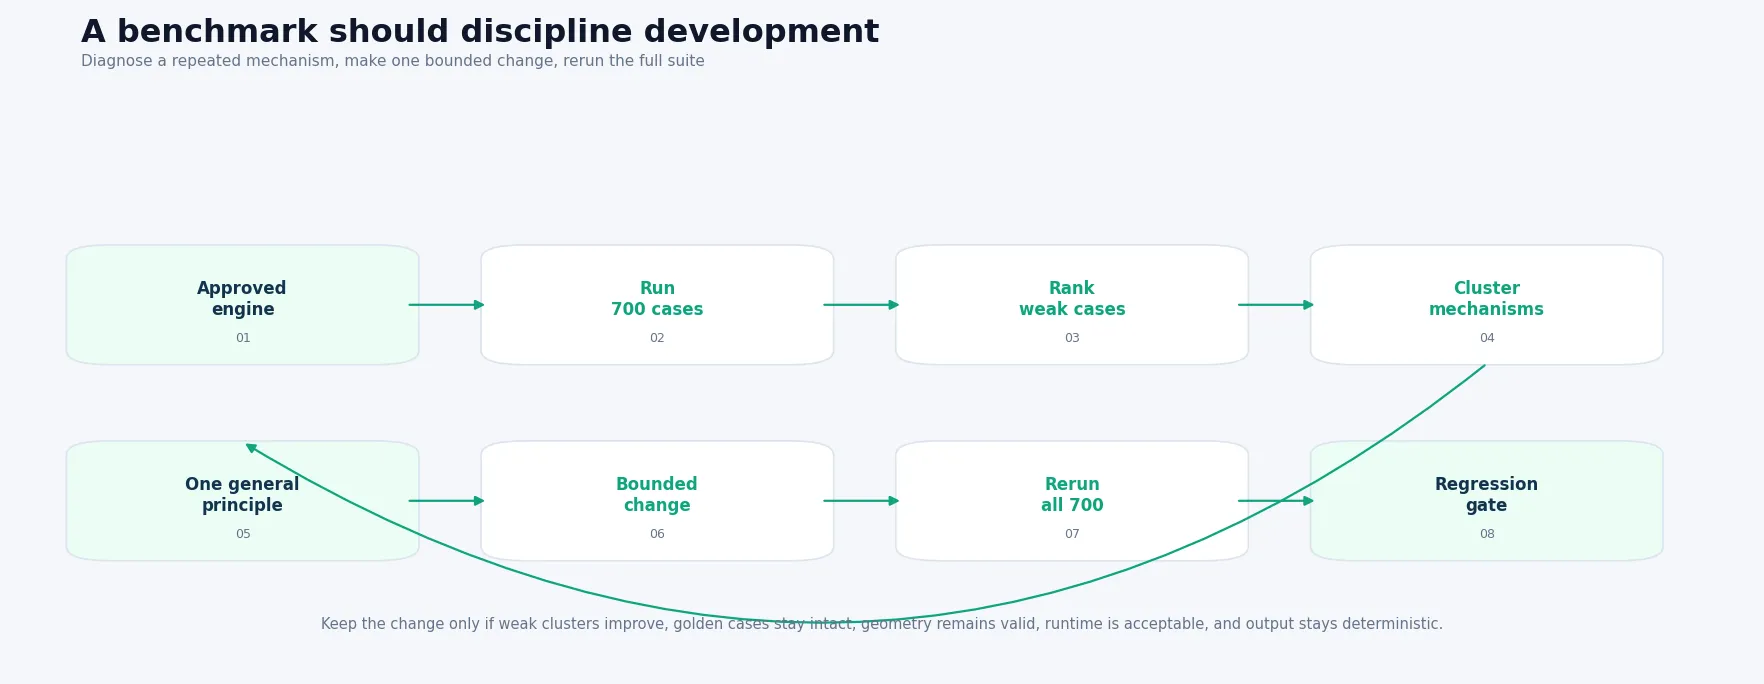
The workflow is deliberately anti-overfitting:
- Run the complete BR benchmark from the current approved engine.
- Rank the genuinely weak cases, preferably by the best result across the two mixed-cargo modes.
- Inspect geometry and diagnostics rather than guessing from the score.
- Cluster repeated mechanisms: product ordering, block construction, residual quantity, frontier depth, side envelope, or supported-top geometry.
- State one generalizable physical or geometric principle.
- Implement one bounded change, then rerun all 700 cases, golden cases, geometry validation, determinism checks, and runtime checks.
A poor case is a diagnostic example, not an acceptance target. We should not optimize BR1-92 until it looks good. We should ask whether several weak cases share a mechanism, whether a generic principle addresses it, and whether the change improves the full distribution without damaging the characteristics KolliPack was designed to preserve.
A fair benchmark is a contract
For two container-loading engines to be compared fairly, the contract should state:
- The same public instances.
- The same exact dimensions and quantities.
- The same orientation permissions.
- The same container and unit conversion.
- The same objective and metric.
- Comparable support assumptions, with unsupported variants labelled separately.
- A large enough sample to expose both strengths and weaknesses.
- The source date, version or snapshot, settings, and unresolved limitations.
That is why one screenshot, one hand-picked shipment, or one “best case” is weak evidence. A good benchmark does not guarantee that the winner is the best tool for every operation. It makes the question precise enough that another engineer can understand what was actually compared.
The honest takeaway
The benchmark did not tell us that KolliPack is optimal. It gave us something more useful: a reproducible baseline, a quantified gap to a strong published full-support academic reference, clear evidence that Mixed Cargo Infill materially improves the constructive engine, and a disciplined way to investigate the remaining losses without overfitting to named cases.
For the BR pure-volume objective, the fairest standalone KolliPack headline is 83.666% in Space Evenly – Mixed Cargo Infill. The 84.453% all-mode envelope is useful for understanding mode complementarity, but it is not a standalone configuration. LoadingMCP's about 85% figure is useful commercial context, but it remains vendor-published and scope-limited.
The next engineering question is not “How do we make one benchmark row look better?” It is “Which general packing principle explains a cluster of weak cases, and can a bounded improvement raise the full distribution while preserving determinism, geometry validity, and operationally understandable loading?”
Try KolliPack Transport Container Loading
Use the calculator to test your own mixed-cargo assumptions. The calculated geometry is decision support, not a certification of physical stability, compression performance, transport safety, compliance, or released packaging.
Sources and evidence boundary
- Dataset provenance: OR-Library container loading and Bischoff & Ratcliff (1995).
- Academic reference: Fanslau & Bortfeldt, “A Tree Search Algorithm for Solving the Container Loading Problem”, with the authors' full paper PDF and Tables 3–4.
- Commercial reference: LoadingMCP Research & benchmarks, accessed 20 August 2026; figures are vendor-published and were not independently reproduced.
- Competition result: Official ROADEF/EURO 2022 final results.
- KolliPack evidence: frozen internal benchmark snapshot dated 18 August 2026, supported by the repository CSV and benchmark handover.